Edge Detection
Detecting edges using derivative of Gaussian kernels, and with Canny edge detector, taking the distance transform, hough transform, and applying mean shift algorithms to detect the edges more consistently.
Edge Detection
In [1]:
import cv2import numpy as npimport matplotlib.pyplot as pltIn [2]:
image = cv2.imread("data/einstein.jpeg", 0)_ = plt.imshow(image, cmap="gray")
Gaussian Kernel
In [3]:
kernel = cv2.getGaussianKernel(ksize=7, sigma=1) kernel = kernel * kernel.T_ = plt.imshow(kernel)
Detecting Edges Using Derivative of Gaussian Kernel
Computing the weights of derivative in x and y of 5x5 Gaussian Kernel with sigma=0.6
In [4]:
def get_derivative_of_gaussian_kernel(size, sigma): y, x = np.indices((size, size)) - (size // 2) kernel_x = -1 * (x / (2*np.pi*sigma*sigma)) * np.exp(-1*(x*x + y*y)/(2*sigma)) kernel_y = -1 * (y / (2*np.pi*sigma*sigma)) * np.exp(-1*(x*x + y*y)/(2*sigma)) return kernel_x, kernel_ykernel_x, kernel_y = get_derivative_of_gaussian_kernel(size=5, sigma=0.6)In [5]:
fig, axs = plt.subplots(1, 2, figsize=(8,8))axs[0].imshow(kernel_x, cmap="gray"); _ = axs[0].set_title("kernel_x")axs[1].imshow(kernel_y, cmap="gray"); _ = axs[1].set_title("kernel_y")
In [6]:
big_kernel_x, big_kernel_y = get_derivative_of_gaussian_kernel(size=51, sigma=25.)fig, axs = plt.subplots(1, 2, figsize=(8,8))axs[0].imshow(big_kernel_x, cmap="gray"); _ = axs[0].set_title("kernel_x")axs[1].imshow(big_kernel_y, cmap="gray"); _ = axs[1].set_title("kernel_y")
In [7]:
edges_x = cv2.filter2D(image, ddepth=cv2.CV_32F, kernel=kernel_x)edges_y = cv2.filter2D(image, ddepth=cv2.CV_32F, kernel=kernel_y)In [8]:
fig, axs = plt.subplots(1, 2, figsize=(15,15))axs[0].imshow(edges_x, cmap="gray"); _ = axs[0].set_title("edges_x")axs[1].imshow(edges_y, cmap="gray"); _ = axs[1].set_title("edges_y")
In [9]:
magnitude = np.float32(np.sqrt(edges_x**2 + edges_y**2)) direction = np.float32(np.arctan2(edges_y, edges_x)) In [10]:
fig, axs = plt.subplots(1, 2, figsize=(15,15))axs[0].imshow(magnitude, cmap="gray"); _ = axs[0].set_title("magnitude")axs[1].imshow(direction, cmap="gray"); _ = axs[1].set_title("direction")
Detecting Edges with Canny Edge Detector
In [11]:
image = cv2.imread("data/traffic.jpg", 0)_ = plt.imshow(image, cmap="gray")
In [12]:
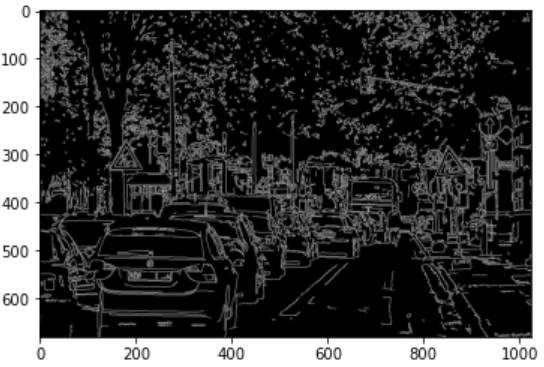
edges = cv2.Canny(image, 200, 400)_ = plt.imshow(edges, cmap="gray")
Distance Transform
In [13]:
dist_transfom_cv1 = cv2.distanceTransform(255-edges, distanceType=cv2.DIST_L2, maskSize=cv2.DIST_MASK_PRECISE)_ = plt.imshow(dist_transfom_cv1, cmap="gray")
Hough Transform
In [14]:
img = cv2.imread('data/shapes.png')img_gray = cv2.cvtColor(img, cv2.COLOR_BGR2GRAY) # convert the image into grayscaleimg_edges = cv2.Canny(img_gray, 50, 100, 3)fig, axs = plt.subplots(1, 2, figsize=(12,12))axs[0].imshow(img, cmap="gray"); _ = axs[0].set_title("original image")axs[1].imshow(img_edges, cmap="gray"); _ = axs[1].set_title("edges")
In [15]:
def draw_line(image, detected_lines, cv2_format=False): """ args: image: edges of the original image detected lines: list of angles(theta) and length(d) return: image of drawn lines on the image based on the given angles and length """ for i in detected_lines: if cv2_format: theta, d = i[1], i[0] theta -= np.pi/2 else: theta, d = i[0], i[1] x = d * -np.sin(theta) y = d * np.cos(theta) x1 = int(x + 1000 * (-np.cos(theta))) y1 = int(y + 1000 * (-np.sin(theta))) x2 = int(x - 1000 * (-np.cos(theta))) y2 = int(y - 1000 * (-np.sin(theta))) cv2.line(image, (x1, y1), (x2, y2), (0, 0, 255), 1) return imageIn [16]:
lines = cv2.HoughLines(img_edges, rho=1, theta=np.deg2rad(2), threshold=30)lines = lines[:,0,:]img_with_lines = draw_line(img, lines, cv2_format=True)_ = plt.imshow(img_with_lines); _ = plt.title("Detected lines with OpenCV Hough Transform")
In [17]:
def myHoughLines(img_edges, d_resolution, theta_step_sz, threshold): """ args: image: edges of the original image d_resolution: quantization of distance theta_step_sz: quantization of theta threshold: for detecting lines return: detected lines: list of angles(theta) and length(d) of corresponding lines accumulator: Output of Hough Transform (possible lines are on bright pixels) """ accumulator = np.zeros((int(180 / theta_step_sz), int(np.linalg.norm(img_edges.shape) / d_resolution))) mask = img_edges==255 yy, xx = np.meshgrid(np.arange(img_edges.shape[1]), np.arange(img_edges.shape[0])) xx_masked = xx[mask] yy_masked = yy[mask] for theta_idx in range(accumulator.shape[0]): theta = np.deg2rad(theta_idx * theta_step_sz) d = xx_masked * np.cos(theta) - yy_masked * np.sin(theta) d_idx = np.round(d / (2*d_resolution)).astype(np.int32) + accumulator.shape[1]//2 np.add.at(accumulator[theta_idx], d_idx, 1) detected_lines = [] tmp = (accumulator>threshold).nonzero() #indexes of values higher than threshold for theta_idx, d_idx in zip(tmp[0], tmp[1]): theta = np.deg2rad(theta_idx * theta_step_sz) d = (d_idx - accumulator.shape[1]//2)*2*d_resolution detected_lines.append((theta, d)) return detected_lines, accumulatorIn [26]:
img = cv2.imread('data/shapes.png')img_gray = cv2.cvtColor(img, cv2.COLOR_BGR2GRAY) # convert the image into grayscaleimg_edges = cv2.Canny(img, 50, 100, 3)detected_lines, accumulator = myHoughLines(img_edges, d_resolution=1, theta_step_sz=2, threshold=50)img_with_lines = draw_line(img, detected_lines)fig, axs = plt.subplots(1, 2, figsize=(12,12))_ = axs[0].imshow(img_with_lines, cmap="gray")_ = axs[0].set_title("Detected lines with My Hough Transform Implementation")_ = axs[1].imshow(np.clip(accumulator, 0, 50)/50, cmap="gray")_ = axs[1].set_title("Output of Hough Transform (Accumulator)")#_ = plt.imshow(accumulator); _ = plt.title("Accumulator")#_ = plt.imshow(img_with_lines); _ = plt.title("Detected lines with My Hough Transform Implementation")
Mean Shift
Mean Shift Algorithm with Uniform Kernel
In [19]:
img = cv2.imread('data/line.png')img_gray = cv2.cvtColor(img, cv2.COLOR_RGB2GRAY) # convert the image into grayscaleimg_gray = cv2.GaussianBlur(img_gray, (3,3), 1)img_edges = cv2.Canny(img_gray, 100, 200, 3) # detect the edgesfig, axs = plt.subplots(1, 2, figsize=(12,12))axs[0].imshow(img, cmap="gray"); _ = axs[0].set_title("original image")axs[1].imshow(img_edges, cmap="gray"); _ = axs[1].set_title("edges")
In [20]:
class MeanShift: def __init__(self, points): self.points = points # (10333, 3) columns: (weight, row coord, col coord) def fit(self, random_starts = 100, bw=20): random_starts = min(random_starts, self.points.shape[0]) centroids = self.points[np.random.choice(self.points.shape[0], random_starts, replace=False)][:,1:] # (100, 2) optimize = True while optimize: diff_3d = centroids[:,None,:] - self.points[None,:,1:] # (100, 10333, 2) = (100, 1, 2) - (1, 10333, 2) distance = np.sum( diff_3d**2 , axis=2) # (100, 10333) in_bandwidth = distance < bw**2 # (100, 10333) weights = self.points[:, 0].reshape(1,-1) # (1, 10333) sum_weights = np.sum( weights * in_bandwidth , axis=1) # (100,) # (100, 10333, 1) = (1, 10333, 1) * (100, 10333, 1) weights_and_mask = weights.reshape((1, weights.shape[1], 1)) * in_bandwidth.reshape( (in_bandwidth.shape[0], -1, 1)) # (100, 10333, 2) = (1, 10333, 2) * (100, 10333, 1) ij_sums = self.points[:, 1:].reshape((1, self.points.shape[0], 2)) * weights_and_mask # (100, 2) = (100, 2) / (100, 1) new_centroids = np.sum(ij_sums, axis=1) / sum_weights.reshape((sum_weights.shape[0], 1)) if np.min(centroids == new_centroids) == 1: # check if nothing changed optimize = False centroids = np.unique(new_centroids, axis=0) # build centroids set return centroidsIn [25]:
theta_res = 1 #resolution of thetad_res = 1 #the distance resolution_, accumulator = myHoughLines(img_edges, d_res, theta_res, 50)_ = plt.imshow(np.clip(accumulator, 0, 50)/50, cmap="gray")_ = plt.title("Output of Hough Transform (Accumulator)")
In [22]:
ii, jj = np.meshgrid(range(accumulator.shape[0]), range(accumulator.shape[1]), indexing="ij")mask = accumulator > 0points = np.stack([accumulator[mask], ii[mask], jj[mask]], axis=1)centroids = MeanShift(points).fit()noise_val = 10pruned_centroids = []for i, j in centroids: if accumulator[int(i), int(j)] < noise_val: continue #print("theta: {} d: {}".format(i,j)) theta = np.deg2rad(i*theta_res) d = (j - accumulator.shape[1]//2)*(d_res*2) pruned_centroids.append((theta,d))image = draw_line(img, pruned_centroids)_ = plt.imshow(image)